
One of the country’s leading property sites, realestate.com.au has reported a 67%* growth on house prices in Ocean Grove since March 2020. In the space of two years property values for Ocean Grove grew at a faster rate than the last 10 years growth combined! The current median sales price of $1,180,000 is over double that of the median 10 years earlier.**
More recently we have experienced rate rises not seen for a decade, inflation at an all-time high and limited wage growth. Property prices across the nation have taken a downturn over the last few months, with a fall of 3.53% from the peak in March^^. Media reports of the “property crash” have proven to be somewhat of an exaggeration. In reality, we are experiencing a market correction.
Have we seen the same market changes faced by the nation in Ocean Grove?
Our agents have experienced some procrastination from buyers, with more hesitation to put forth an offer at the higher end of vendor expectations. Fewer buyers have been attending open homes. Potentially the most telling sign, there are currently over 200 properties for sale in Ocean Grove^ a sign of a slow in transactions and vendors failing to meet the expectations of buyers. The number of sales recorded in Ocean Grove in 2022 currently sits at 196 with just one month left of the year, this is compared to 442 sales for 2021^*.
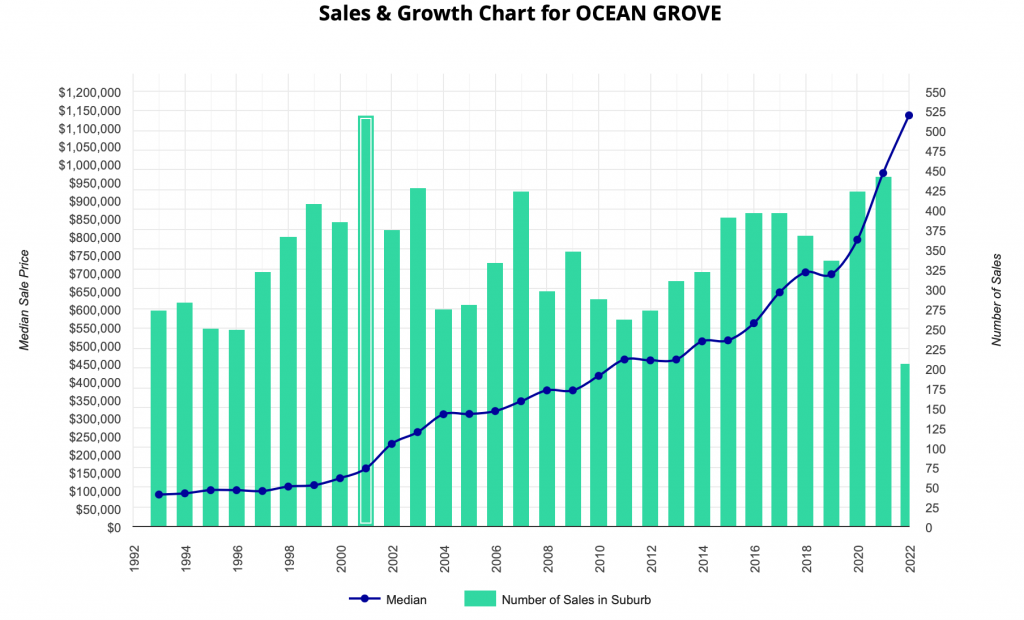
Source: PriceFinder 24/11/2022
The Ocean Grove real estate market has most definitely arrived at a new era. And with this comes new challenges and complexities. It has never been more important to have patience in your campaign and to keep up to date with recent sales. Research and current statistics have never been more crucial – current campaigns cannot be compared to those of 12 months ago when it comes to campaign length or result. Success is not out of reach for buyers or sellers who familiarise themselves with the current conditions.
* data sourced from realestate.com.au – change in median house price compares 12 month rolling sales ending March 2020 to 12 month rolling sales ending October 2022.
**realestate.com.au reports median sale price $1,180,000 with data collected from November 2021 to October 2022. This data has been compared to Pricefinder reported median sale price from 2012 as $457,616
^^data sourced from realestate.com.au 24 November 2022
^data sourced from realestate.com.au based on properties currently listed for sale on 24 November 2022.
^*data sourced from pricefinder 24 November 2022